Radiant offers dedicated systems for testing illuminated keyboards, control panels, buttons & indicators, and signage in high-volume manufacturing environments. Our decades-long history of developing photometry-based solutions for light and color measurement has put us in a unique position. While we have had photometry as our foundation, additional inspection needs around lighted components have provided an opportunity for us to develop expertise in addressing some of the more challenging vision inspection problems. With products that now combine the precision of photometric light measurement with advanced machine vision tools and OCR capabilities, manufacturers of automotive dashboards and controls, avionics cockpit panels, backlit keyboards, and illuminated signage can benefit from powerful integrated solutions for automated inspection of backlilt characters and symbols.
Characteristics such as luminance, contrast, character shape and completeness (no exclusions of inclusions), position/orientation, and validation (is it the correct letter/number) can all be assessed simultaneously from a single image using our ProMetric imaging photometers and colorimeters with purpose-built software. Robust quantitative analysis and reporting enables customers in regulated industries such as automotive and aerospace to capture the data they need to ensure compliance with requirements.
Keyboards
Testing and Quality Control for Computer Keyboards, Laptops, and Mobile Devices
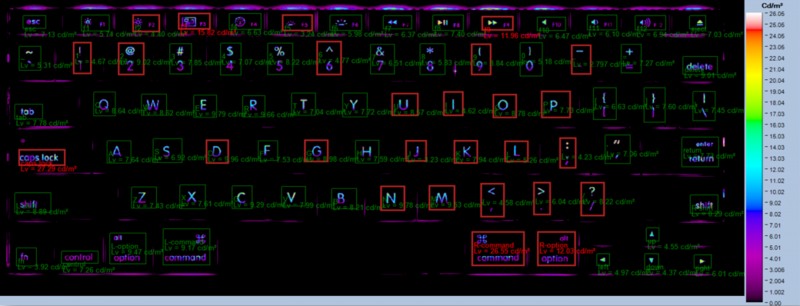
Illuminated keyboards and keypads can exhibit variations in brightness and color from key to key, and even within keys, that are noticeable to the end-user. These flaws detract from the user experience and, in some cases, strongly impacts overall product usability. Radiant offers a dedicated system for automated visual inspection of illuminated keyboards and keypads to measure luminance and chromaticity of individual characters and the overall keyboard. Our PM-KB™ Illuminated Keyboard Testing Software system also performs optical character recognition (OCR), allowing the software to determine if keycaps are installed correctly and each key is in its proper location.
Keyboard analysis shown in PM-KB Software. Output data includes individual character luminance (Lv), individual key luminance, local luminance versus proximal keys for individual keys, and full keyboard uniformity. All values can be evaluated against programmed thresholds for minimum and maximum luminance.
Related Links:
Symbols, Indicators, and Halos
Quality Inspection for Illuminated Control Panels
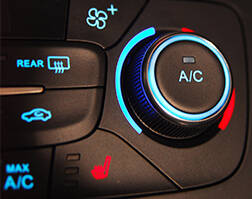
Makers of control panels found in products that can directly impact safety and health—such as those produced by the automotive, aerospace, and medical equipment industries—must have accurate and reliable test systems for their backlit devices. It is vital ensure the visibility and legibility of illuminated icons, text, and shapes. Radiant’s integrated systems measure brightness, color, and detect nonuniformity in buttons, switches, indicators, and light strips. Radiant's VIP™ (Vision Inspection Pack) software combines photometric measurement with defect detection to identify inclusions, exclusions, and other symbol integrity issues. Our imaging technology can test multiple areas simultaneously, capturing and processing data much faster and more consistently than a human inspector or a spot measurement device.
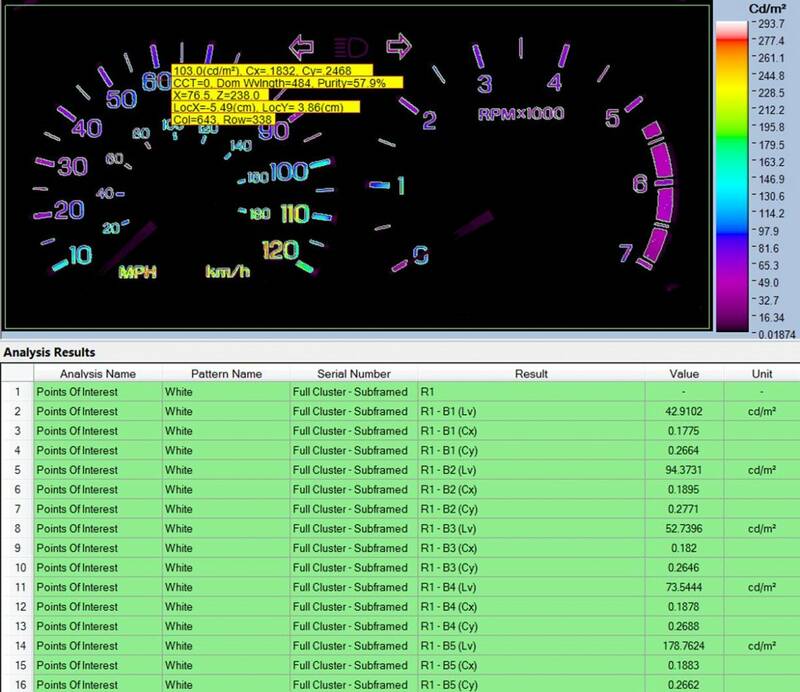
From TrueTest™ Software, this image shows an analysis of an automotive speedometer region. Each individual illuminated symbol is tested to output its luminance (Lv, given in cd/m2) and chromaticity (Cx,Cy) values.
Related Links:
Backlit Signs & Films
Design and Production Qualification for Large Backlit Areas
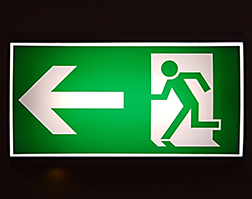
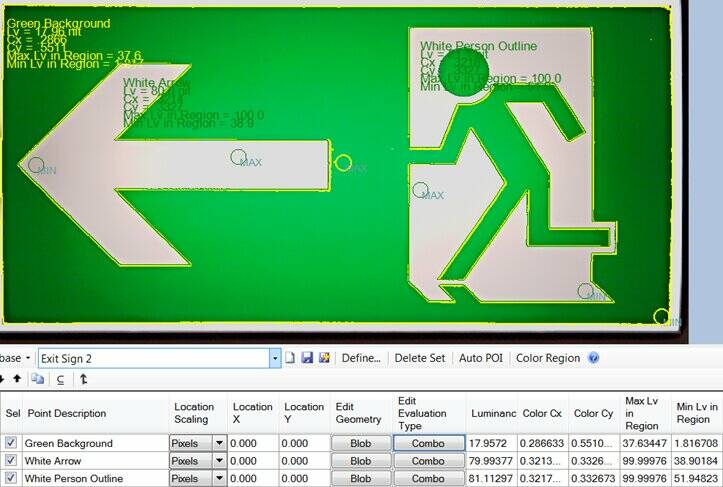
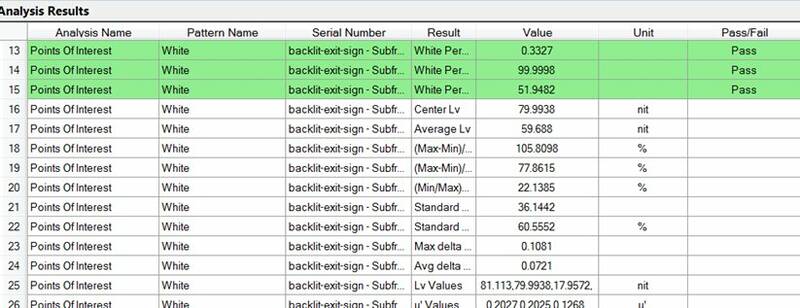
Manufacturers of backlit signage and films know the importance of designing according to strict light and color tolerances, regardless of the number of regions across a sign. In production, achieving the same level of quality means testing out variability in backlights and overlays, ensuring consistency from part to part. Radiant’s light and color measurement systems are used to ensure uniformity in backlit signs and films that are used for public signage, aerospace cabins, directional and information panels, and appliance controls. These support customer specifications regarding color and brightness of signs for consistency across installations, and in any ambient lighting. Values captured by Radiant's software include average luminance of each colored region, minimum and maximum luminance points, color uniformity in each region, and dominant wavelengths.
From TrueTest™ Software, this image shows an analysis of a backlit exit sign. First (top), luminance (Lv) and chromaticity (Cx,Cy) values are measured for each green and white region. Then (below), data values are evaluated against programmed color thresholds for each region.


