The Language of Color: Measuring Light & Displays
Previously in this blog we’ve discussed the Language of Light (e.g., photometric quantities such as luminance, illuminance, luminous flux). In this post we look at the language and concepts of color and color measurement.
Human Color Perception
The visible spectrum of light (a small portion of the full electromagnetic spectrum) ranges from wavelengths of approximately 380-740 nanometers (nm). Rods and cones in the human eye respond to light waves; the cones determine how we perceive color.

The spectrum of light that is visible to humans, from roughly 380-740 nm. This is just a small sliver of the entire electromagnetic spectrum that extends from super-short-wavelength gamma rays (0.0001 nm) to extremely long radio waves (up to 100 meters).
We have three types of cones—long, medium, and short (or L, M, and S)—each sensitive to a specific range of wavelengths. We perceive different wavelengths at different strengths, blended to encompass the area under each of the curves in the graph below.

Spectral response of human vision within the fovea region (the central 2° of our field of view where our eyes have the highest density of cones). The graph is a rough illustration of the normalized response of the cones; i.e., how powerful we perceive each wavelength to be. The peak of each curve is where our perception of that color is strongest.
Spectral Power Distribution (SPD)
Understanding the human visual response—our spectral sensitivity—helps us plot how we perceive various light sources, as characterized by their spectral power distribution (SPD). Like in the graph above, an SPD is plotted by power as a function of wavelength. The difference is that an SPD plots the total output power of a light source, rather than what our eyes perceive. The SPD describes how much optical power the light source emits for each wavelength band. Wavelength (in nm) is on the X-axis. Spectral power (measured in Watts per nanometer, W/nm) is distributed on the Y-axis, often normalized as an arbitrary unit such as intensity or power.
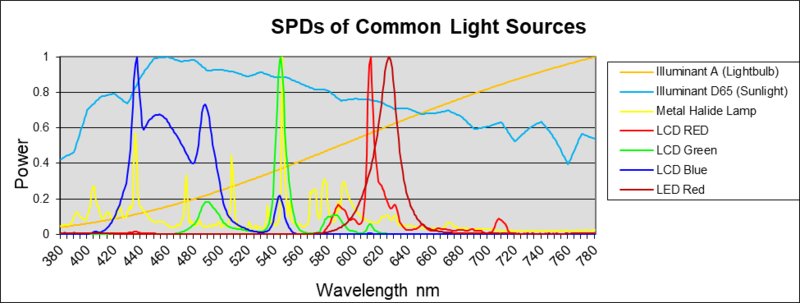
SPDs of common light sources. Illuminant A, for example, is a broadband light source that emits at every wavelength and with increasing intensity at longer wavelengths. In contrast, the red LED has a very narrow spectrum, emitting light primarily between 620 and 650 nm.
Quantifying Color: The CIE Color Space
In 1931, the CIE (Commission Internationale de L’Eclairage, International Commission on Illumination) defined a standard for scientifically quantifying the physical properties of colors. The CIE color space encompasses the human eye’s total perceivable range of color represented as a two-dimensional diagram. Each color we see is a blend of three values (Red, Green, and Blue), which are shown at the three extreme points of the triangular color space. The numerical values along the edge of the color space (the spectral locus) are pure hues of a single wavelength (monochromatic).
To quantify color as a coordinate on this color space, the CIE specifies mathematical “color matching functions,” derived based on relative values of the three primaries at any point in the color space, called tristimulus functions: X, Y, and Z.

A graphical representation of the CIE 1931 color space, charting all colors visible to the human eye. Numbers around the edge of the are wavelengths of monochromatic light defining the boundaries of the color space. Inside the color space, each perceptible color has a coordinate called CIEx, CIEy. The black body (Planckian) locus coordinates are shown on the curved line near the center; the black-body temperature is commonly called Correlated Color Temperature, or CCT and measured in Kelvin (K).
The black-body locus (also called the Planckian locus) shown is a plot of the chromaticity coordinates of light sources known as black-body radiators (an idealized object that absorbs all incident light and is also a perfect emitter). The black-body curve is shown within the CIE diagram to indicate the points where the light appears white.
Since its inception, the CIE color space has enabled accurate measurement, representation, and replication of colors for a vast range of applications such as printing, light source characterization, optical design, and measurement of illuminated display screens. The CIE color space has also been rescaled, once in 1960 and again in 1976. The 1976 color space is designed to approximate the proportion of perceived color differences, i.e., so the distance between two points on the graph more accurately represents the extent to which a human eye perceives color differences. The CIE 1960 color space was the foundation of the system to quantify another color concept, color temperature.
Correlated Color Temperature
White light is produced using combinations of all the colors in the visible spectrum. Correlated color temperature (CCT) is a way to characterize the color appearance (to a human observer) of any white light source using a single number. Different amounts of the various wavelengths cause the light to appear “cooler” (if it contains more blue/cyan wavelengths) or “warmer” (if it contains more yellow/orange wavelengths). Different light sources with very different SPDs can all appear white to our eyes.

Comparing the SPD of various light sources, all of which appear “white” to our eyes but have different spectral distributions. For example, a “warm” white LED is most intense at approximately 625 nm (the orange-red region), while a bright “daylight” white LED is most intense at approximately 450 nm (the cyan/blue region). (Image Source)
The CCT of a light source is the point on the Planckian locus that matches most closely (perceptually) to the chromaticity coordinates of the light—called its color temperature—measured in degrees Kelvin (K).
It might seem slightly counter-intuitive when compared to thermal temperature measurements such as Fahrenheit where higher values = warmer temperatures. When measuring CCT, however, lower values (e.g., 1800-2700 K) are considered warm tones, neutral white is about 4000 K, and the higher values such as 5000 K and above are the coolest CCTs.

Comparing the appearance of various white LEDs that have different CCT values. (Image Source)
Note that CCT is not equivalent to SPD. CCT characterizes how humans perceive the color tonality of a light source; SPD captures the entire spectrum of wavelengths that is output by the light source, including some that are invisible to the human eye. CCT can be understood as an approximation of spectral content.
Assessing Color Displays
A term that is used often to describe any display device is its “color gamut.” This refers the total range of color the display is capable of producing. To date, no man-made display device has come close to replicating the complete spectrum of light and color perceptible to the human eye (the total CIE color space).

Comparison of the CIE 1931 color space to the gamut of a typical HDTV display. While the television can produce vivid and exciting images to the viewer, the range of color is still limited compared to the full capabilities of human vision. (image Source)
Display makers continue to strive to expand the gamut and produce ever more vivid and varied on-screen colors. In the development process and on the production line, how do manufacturers ensure that displays will deliver the most accurate colors and the highest visual quality and performance? They measure them.
Measuring Light Source & Display Color
How do we measure the color output of a light source or display device? There are a variety of metrology instruments available, suitable to different types of measurement for visual performance and quality assessment.
Radiometry is the science of measuring wavelengths across the entire electromagnetic spectrum, thus a radiometer can measure infrared, visible, and ultraviolet light waves. A photometer measures the brightness (luminance) of visible light as it is perceived by the human eye.
Colorimetry is the science of measuring color (chromaticity) as it is perceived by the human eye. Some instruments, such as a spot meter, can measure both luminance and chromaticity. As the name suggests, spot meters measure one small area (spot) at a time. They typically provide high accuracy at a relatively low cost and can be especially useful in the display R&D process. A spectrometer is a type of spot meter. Likewise, it provides highly accurate chromaticity measurements as well as spectral data.
Another type of equipment used to measure color performance is an imaging system, such as Radiant’s ProMetric® Imaging Colorimeter. Unlike spot meters, an imaging system captures an entire light source distribution or complete display screen in a single image. It uses a 2D detector (image sensor) to measure multiple points of light simultaneously, in a 2D spatial context. The role of imaging systems in display metrology is to simulate our own human visual system—to evaluate the entire display at once just as our eyes take in our whole phone or TV screen in one glance.
| Instrument Type | Typical Display Characteristics Measured |
|---|---|
| Spot meter | Luminance, Chromaticity, Contrast, Gamut, Gamma, Flicker... |
| Imaging system | Luminance, Chromaticity, Uniformity, Contrast, Mura, Defects, Pixel-level analysis, Distortion... |
| Spectroradiometer | Radiance, Luminance, Chromaticity, Spectra... |
| Others | Response time, Viewing direction... |
Imaging systems strike a balance between the accuracy of a spot meter and the ability to capture all data points for spatial representation. In many of today’s applications, an imaging colorimeter is the best tool to assess overall visual performance, encompassing:
- Contextual evaluation: uniformity, gradient, contrast, mura (blemishes), distortion
- Location, identification, and severity of defects (pixels, lines, blobs)
- Simultaneous measurement of multiple regions of interest (LED arrays, pixels, subpixels)
- Determining dimensions, distortion and focus quality (projection displays)
- Advanced analysis with multiple analyses possible per image captured
Importance of Display Metrology
Display metrology gives manufacturers an objective understanding of the quality of their products. Differences in technology, fabrication processes, and other factors cause variations in visual display quality such as defects (e.g., dead pixels) or a non-uniform appearance. Data captured by metrological instruments enable display makers to evaluate visual qualities of a display screen to ensure it meets product specifications and will satisfy customer expectations, safeguarding manufacturing investment and brand reputation.
“Display metrology incorporates scientific methods and equipment to capture, quantify, and assess these qualities as values of brightness, color, uniformity, contrast, and more. Using this data, manufacturers can set objective limits on these qualities and determine whether variations fall in or outside of required performance parameters,” explains Jens Jensen, Radiant’s Director of Product Development. The science of display metrology applies universal measurement principles across devices and industries. This standardization has enabled highly efficient measurement by machines, automating inspection processes from design to production.
Systems that are used to measure the color and brightness of displays must be able to capture sufficient data to provide an accurate quality assessment. Today, measurement systems are rapidly evolving to address needs for new display types and integrations and to keep up with technology advancements such as OLED, microLED, and quantum dots.

ProMetric® Imaging Colorimeters provide high-resolution, high-volume, accurate automated optical inspection of displays, backlit components, light sources, and assemblies.
Dig Deeper: The Science of Measuring Display Quality
For professionals in the display industry, it is important to understand the building blocks of metrology, the tools that are available, and which tools offer the greatest benefits for specific applications. This post has barely scratched the surface. To learn more about display characterization and measurement, watch the Short Course “Fundamentals of Display Metrology.” Originally delivered on May 20 at the virtual SID (Society for information Display) 2021 Display Week, this 3.5-hour course is co-presented by Jensen and colleagues from our sister companies: Dr. Reto Häring from Instrument Systems and Yutaka Maeda of Konica Minolta.
The course introduces the fundamental and standard principles of display metrology, how they were developed, and how they are applied to measure visual display qualities. It covers a range of topics, beginning with an introduction to the science of light and color, units of measurement, and international measurement standards. Presenters describe technologies that apply these principles for automated display testing, including spot meters, imaging equipment, time-resolved meters, and spectroradiometers.

Join Mailing List
Stay up to date on our latest products, blog content, and events.
Join our Mailing List